In the world of quantitative trading, Pine Script has become the de facto language for strategy development and technical analysis on TradingView. However, developers often face a significant hurdle when they want to bring those same indicators into their own web applications, proprietary dashboards, or fintech platforms.
At QuantForge, we’ve built a powerful ecosystem to solve this. In this comprehensive tutorial, we will walk you through how to use PineTS – our high-performance Pine Script execution engine – and QFChart to create a professional-grade, interactive technical analysis tool directly in the browser.
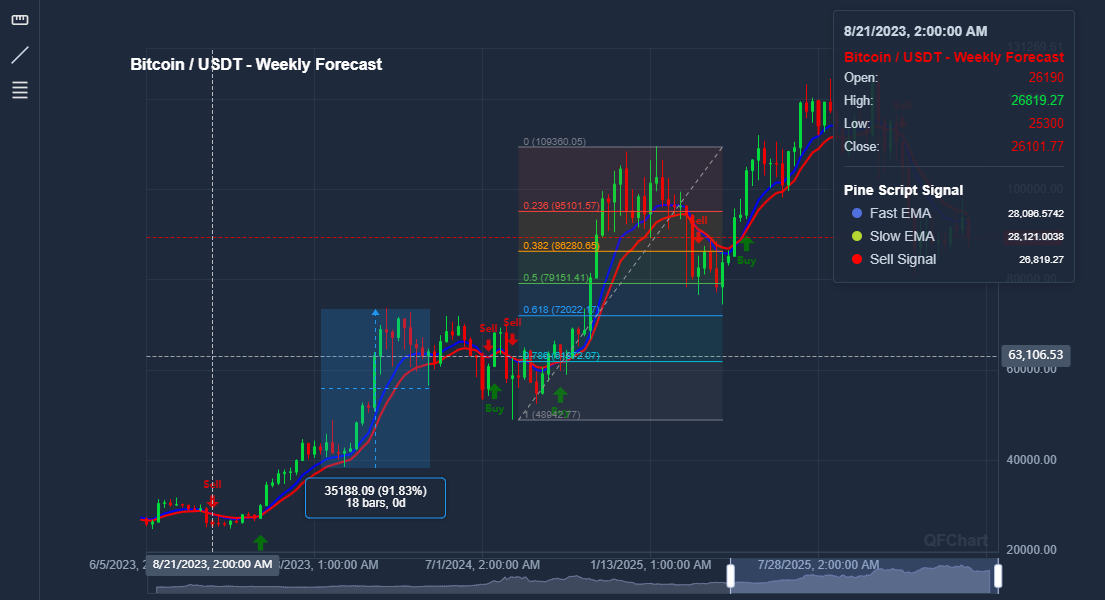
At the end of this tutorial you will be able to run overlay indicators in a candlestick chart like this :
What is PineTS and QFChart?
Before diving into the code, it is essential to understand the roles of each library in our stack:
- PineTS: This is a specialized TypeScript-based runtime. Its primary job is to take raw Pine Script code, fetch the necessary market data (from sources like Binance), and execute the script logic to produce numerical results (plots). It effectively allows you to run “TradingView logic” anywhere JavaScript can run.
- QFChart: While PineTS handles the “math,” QFChart handles the “visuals.” It is a charting library optimized for financial data. Built on top of the robust Apache ECharts engine, it provides high-performance rendering for OHLCV (Open, High, Low, Close, Volume) data and seamless overlaying of technical indicators.
Prerequisites
To follow this tutorial, you will need:
- A basic understanding of modern JavaScript (Promises, async/await).
- A Pine Script source file (we will use a script called
cross-signal.pine). - Access to the PineTS and QFChart libraries (available via our CDN or as NPM packages).
Step 1: Setting up the HTML Structure
A clean environment is the foundation of a good dashboard. We start by importing the core dependencies. Note that ECharts must be loaded before QFChart as it serves as the rendering backbone.
<!DOCTYPE html>
<html lang="en">
<head>
    <meta charset="UTF-8">
    <meta name="viewport" content="width=device-width, initial-scale=1.0">
    <title>QuantForge - PineScript Web Demo</title>

    <!-- External Dependencies -->
    <script src="https://cdn.jsdelivr.net/npm/echarts/dist/echarts.min.js"></script>

    <!-- QuantForge Libraries -->
    <script src="https://cdn.jsdelivr.net/npm/pinets/dist/pinets.min.browser.js"></script>
    <script src="https://cdn.jsdelivr.net/npm/@qfo/qfchart/dist/qfchart.min.browser.js"></script>

    <style>
        body { font-family: 'Inter', sans-serif; margin: 0; padding: 20px; background: #f0f2f5; }
        h1 { color: #1a1a1a; text-align: center; }
        #chart-container {
            width: 100%;
            height: 650px;
            background: #ffffff;
            border-radius: 12px;
            box-shadow: 0 10px 25px rgba(0,0,0,0.05);
            overflow: hidden;
        }
    </style>
</head>
<body>
    <h1>Advanced Financial Indicator Deployment</h1>
    <div id="chart-container">Initialising visualization engine...</div>
</body>
</html>Step 2: Fetching Market Data and Executing Pine Script
The true power of PineTS lies in its abstraction. You don’t need to manually manage WebSocket connections or REST API calls for historical data.
In this step, we create an execution helper. It initializes a PineTS instance pointing to a specific provider (Binance in this case) and a symbol. When run() is called, the library fetches the historical candles and processes the Pine Script logic in a sandboxed environment.
async function runIndicator(pineCode) {
    // PineTS handles the heavy lifting: data fetching and logic execution
    const pineTS = new PineTS(
        PineTS.Provider.Binance,
        'BTCUSDT',
        '1w',  // Timeframe: 1 week candles
        500    // Depth: Load last 500 candles
    );

    // This returns the result of the calculations, the plots (lines/shapes),
    // and the raw market data used.
    const { result, plots, marketData } = await pineTS.run(pineCode);

    return { marketData, plots };
}
Step 3: Preparing Data for QFChart
Data interoperability is key. PineTS provides a rich object for market data, but QFChart requires a clean array of OHLCV objects. This transformation step ensures that the timestamp and price values are mapped correctly for the chart’s time-axis.
function formatOHLCV(marketData) {
    return marketData.map(k => ({
        time: k.openTime,
        open: k.open,
        high: k.high,
        low: k.low,
        close: k.close,
        volume: k.volume
    }));
}
Step 4: Initializing the Interactive Chart & DataBox
Now we configure the QFChart instance. A crucial part of the user experience is the DataBox (the overlay showing price details).
In the configuration below, we introduce the databox property. The position option is highly versatile:
right: Fixes the data information to the right side of the chart.left: Fixes it to the left side.floating: The box follows the mouse cursor, providing a more dynamic and “modern” feel.
async function init() {
    // 1. Fetch the raw Pine Script source code
    const response = await fetch('./data/cross-signal.pine');
    const pineCode = await response.text();

    // 2. Execute calculation via PineTS
    const { marketData, plots } = await runIndicator(pineCode);
    const ohlcvData = formatOHLCV(marketData);

    // 3. Initialize QFChart with custom configuration
    const container = document.getElementById('chart-container');
    const chart = new QFChart.QFChart(container, {
        title: 'Bitcoin / USDT - Weekly Forecast',
        height: '600px',
        databox: {
            position: 'floating', // Options: 'right', 'left', 'floating'
        },
        layout: {
            mainPaneHeight: '70%',
            gap: 10
        },
        dataZoom: { visible: true, position: 'bottom' }
    });

    // 4. Set the candle data
    chart.setMarketData(ohlcvData);

    // 5. Add the computed indicator plots
    chart.addIndicator('Pine Script Signal', plots, {
        isOverlay: true,
        titleColor: '#2962FF'
    });
}

document.addEventListener('DOMContentLoaded', init);
Step 5: Enhancing User Interaction with Drawing Plugins
To move from a static view to a professional analysis tool, users need to interact with the price action. QFChart supports a plugin architecture for Drawing Tools.
These plugins allow users to manually annotate the chart, measure price movements, or identify support and resistance levels. You can register them individually depending on the needs of your application:
// Registering drawing capability plugins
chart.registerPlugin(new QFChart.MeasureTool());   // Tool to measure % and price change
chart.registerPlugin(new QFChart.LineTool());      // Support/Resistance and Trend lines
chart.registerPlugin(new QFChart.FibonacciTool()); // Auto-calculating Fibonacci levels
Conclusion
By leveraging the QuantForge ecosystem, you can deploy complex trading indicators to the web in minutes rather than weeks. PineTS removes the complexity of data management and script parsing, while QFChart provides a high-performance, customizable UI that rivals industry leaders.
Why choose this stack?
- Zero Backend Footprint: All calculations can happen in the user’s browser, reducing server costs and latency.
- Direct Portability: Your existing Pine Script library becomes an instant web asset.
- Highly Flexible UI: From floating databoxes to custom drawing plugins, you have full control over the user experience.
Ready to start? Check out the documentation and contribute to our open-source mission:
Are you building something interesting? Share your projects with us at quantforge.org.
Leave a Reply