QFChart v0.8 spans six releases –v0.7.0 through v0.8.1 -and marks a significant shift in the library’s direction. While v0.6 established the foundation for drawing objects and plot styles, v0.8 transforms QFChart from a charting library into an interactive technical analysis platform. This release adds a complete suite of drawing tools (Fibonacci analysis, harmonic patterns, classical patterns), an extensible plugin architecture that supports third-party tools, and a long list of rendering improvements and bug fixes.
What’s Covered in v0.8
| Version | Highlights |
|---|---|
| v0.7.0 | Box, polyline, and table drawing objects |
| v0.7.1 | Rendering hotfixes (plot color na handling, drawing tools clipping) |
| v0.7.2 | Gradient fill support |
| v0.7.3 | Resizable indicator panes, histogram rewrite |
| v0.8.0 | Canvas table renderer, lazy viewport expansion, rendering overhaul |
| v0.8.1 | Plugin system refactor, chart patterns, Fibonacci tools, snap-to-candle |
Chart Pattern Drawing Tools
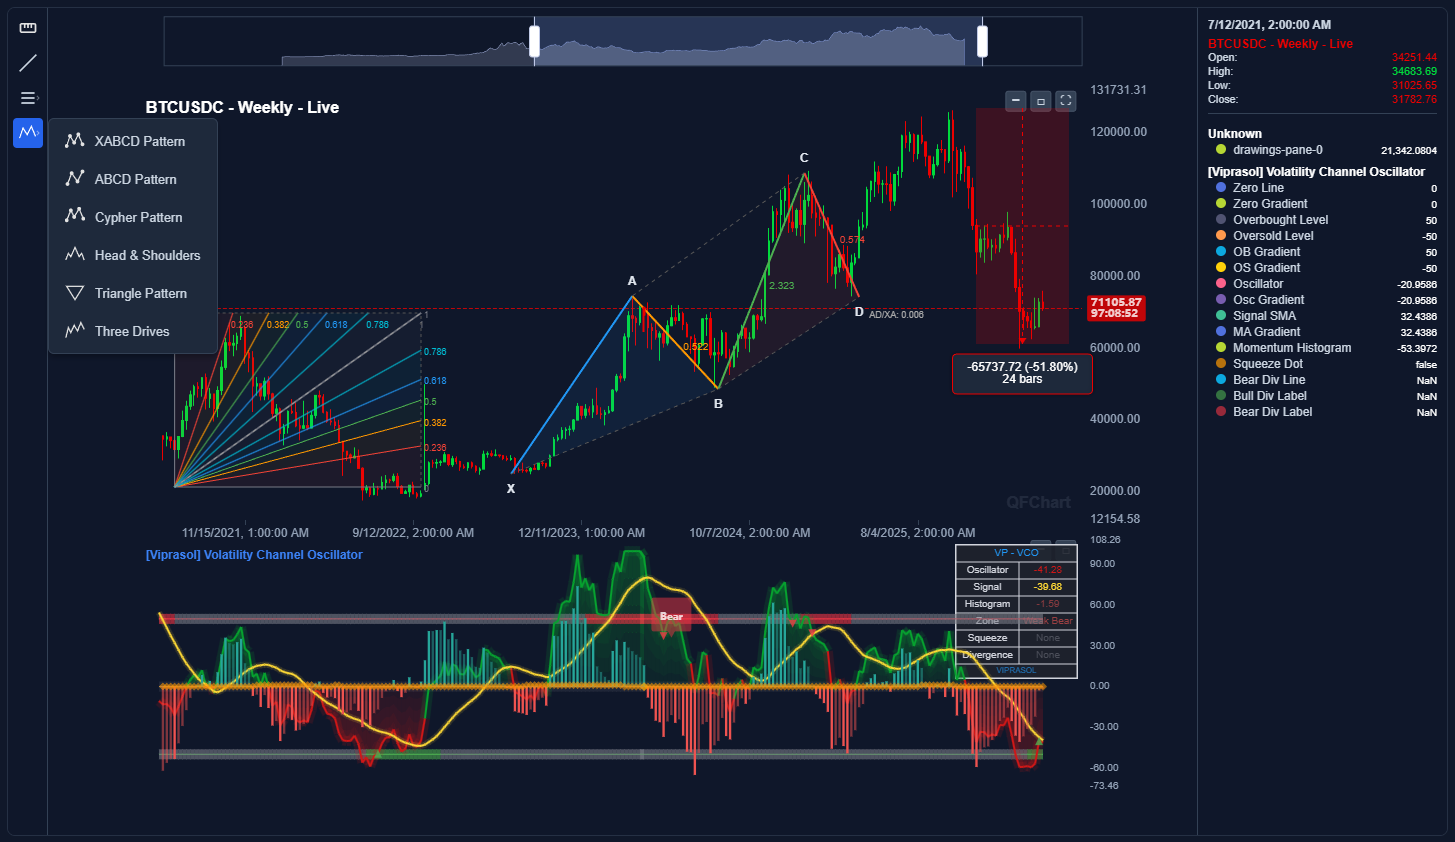
The most visible addition in v0.8 is a full suite of chart pattern drawing tools -the kind of tools you’d find in TradingView’s toolbar. Each tool is a multi-click interaction where you place points on the chart to define a pattern, and the tool draws the connecting structure with labels, Fibonacci ratio annotations, and shaded zones.
Harmonic Patterns
Harmonic patterns are price structures where each leg has a specific Fibonacci ratio relationship to the others. Traders use them to identify high-probability reversal zones. When the ratios align, the D point becomes a potential entry with a well-defined risk/reward setup.
| Tool | Points | Description |
|---|---|---|
| XABCD Pattern | 5 clicks | The classic harmonic pattern (Gartley, Butterfly, Bat, Crab). Draws a zigzag X→A→B→C→D with filled XAB/BCD triangles and Fibonacci ratios on each leg (AB/XA, BC/AB, CD/BC, AD/XA). |
| ABCD Pattern | 4 clicks | A simpler four-point harmonic. Draws A→B→C→D with BC/AB and CD/BC ratio annotations. |
| Cypher Pattern | 5 clicks | Five-point Cypher with XC/XA and CD/XC ratio labels and a distinct color scheme. |
| Three Drives | 7 clicks | Three progressively extending impulse moves with correction ratios (D2/D1, D3/D2) and drive-to-drive connector lines. |
For example, to identify a Gartley pattern on a BTC/USDT daily chart, you would look for a swing where AB retraces 61.8% of XA, BC retraces 38.2-88.6% of AB, and CD extends to 127.2-161.8% of BC. The XABCD tool draws all five points, computes these ratios automatically, and displays them on the chart so you can quickly verify whether the structure qualifies as a valid Gartley, Butterfly, Bat, or Crab.
The ABCD pattern is useful as a standalone trade setup or as a building block for spotting larger harmonic structures. It appears frequently on all timeframes and assets. A common application is identifying potential continuation moves after a pullback: if BC retraces ~61.8% of AB, the CD leg often completes near the 127.2% extension of BC.
The Three Drives pattern helps identify trend exhaustion. Each successive drive extends further than the previous one (typically at 1.272 or 1.618 ratios), signaling that momentum is fading and a reversal may follow.
Classical Patterns
Classical chart patterns are visual structures that form during price consolidation or reversal phases. Unlike harmonic patterns which rely on precise Fibonacci ratios, classical patterns are based on the geometry of the price action itself.
| Tool | Points | Description |
|---|---|---|
| Head & Shoulders | 7 clicks | Full H&S structure with labeled vertices (LS, H, RS), filled shoulder and head regions, and an extended neckline. |
| Triangle | 5 clicks | Alternating high/low points with converging upper and lower trendlines (extended with dashed projections), plus a filled interior. |
The Head & Shoulders tool is one of the most widely used reversal pattern identifiers in technical analysis. On a weekly BTC chart, for instance, you might spot a left shoulder forming at $60K, a head at $69K, and a right shoulder at $62K, with a neckline connecting the two troughs around $55K. The tool draws the full structure, fills the shoulder and head regions for visual clarity, and extends the neckline across the chart. The neckline break is the key signal: once price drops below it, the measured move target equals the distance from the head to the neckline, projected downward from the break point.
The Triangle tool is useful for identifying consolidation patterns where price makes lower highs and higher lows (symmetrical triangle), lower highs against a flat support (descending), or higher lows against a flat resistance (ascending). The tool connects alternating swing points and draws extended trendlines to project where the apex (convergence point) lies. Breakout traders watch for price to exit the triangle on expanding volume.
All patterns support selection, drag-to-move, and individual point editing. You can drag any control point to adjust the pattern after placement.
Fibonacci Drawing Tools
Alongside the patterns, four new Fibonacci analysis tools round out the drawing toolkit. Together with the existing Fibonacci Retracement (from v0.5), QFChart now covers the five most commonly used Fibonacci tools in technical analysis.
Fibonacci Channel (3 clicks)
Click 1-2 define the baseline (typically connecting two swing lows or two swing highs), click 3 sets the channel width by clicking the opposite extreme (e.g., the swing high between the two lows). The tool draws parallel lines at Fibonacci ratios (0, 0.236, 0.382, 0.5, 0.618, 0.786, 1) offset perpendicular to the baseline. These are truly parallel, not just vertically shifted, so they follow the slope of the trend. Shaded zones fill the space between adjacent levels.
Fibonacci channels are commonly used for trending markets where price moves within a channel. In an uptrend, the baseline connects two swing lows and the 1.0 level passes through the swing high. Fibonacci levels between 0 and 1 act as potential support during pullbacks within the trend. If price breaks above 1.0, the 1.618 and 2.618 extensions (if displayed) become potential targets.
Fibonacci Trend-Based Extension (3 clicks)
Click 1-2 define the initial trend move (e.g., a rally from $40K to $60K), click 3 defines the retracement point (e.g., pullback to $50K). The tool projects extension levels beyond the initial move, including levels above 1.0 (1.272, 1.618, 2.0, 2.618), showing where price might reach if the trend resumes from the pullback. Horizontal lines span the chart width at each projected level with price labels.
This is one of the most practical tools for setting profit targets. For example, if BTC rallied $20K and then pulled back, the 1.0 extension from the pullback gives a target of the pullback price + $20K, the 1.618 extension gives pullback + $32.36K, and so on. Swing traders commonly take partial profits at the 1.0 and 1.272 levels, with the 1.618 level as an ambitious target.
Fibonacci Speed Resistance Fan (2 clicks)
Two clicks define the price/time rectangle (e.g., a significant low to a significant high). The tool draws diagonal fan rays from the start point at Fibonacci ratios of both the price axis and time axis, creating a spread of rays that radiate from the origin. Zones between rays are filled with semi-transparent color.
Speed resistance fans combine both time and price analysis. The price rays show what fraction of the total price move has been retraced, while the time rays show the fraction of total time elapsed. When price interacts with both a time ray and a price ray at the same point, it creates a stronger support or resistance zone. This tool is especially useful on higher timeframes (daily, weekly) for identifying long-term trend structure.
Existing Tools
The Measure Tool, Trend Line, and Fibonacci Retracement from v0.5 continue to work as before.
Snap to Candle (Ctrl / Cmd)
All drawing tools now support magnetic snapping. Hold Ctrl (or Cmd on Mac) while clicking or moving the cursor, and the point snaps to the nearest candle’s closest OHLC value (open, high, low, or close).
A small blue indicator circle appears at the snapped position, giving visual feedback before you click. This works during the entire drawing interaction -from the first point placement through the last.
The snap system is built into the AbstractPlugin base class, so it works for every built-in tool and any custom plugin that extends it.
Tool Groups
With 12 drawing tools available, the toolbar needs organization. The new ToolGroup class wraps multiple related plugins under a single toolbar button with a dropdown chevron:
const fibGroup = new QFChart.ToolGroup({
  name: 'Fibonacci Tools',
  icon: `<svg>...</svg>`,
});
fibGroup.add(new QFChart.FibonacciTool());
fibGroup.add(new QFChart.FibonacciChannelTool());
fibGroup.add(new QFChart.FibTrendExtensionTool());
fibGroup.add(new QFChart.FibSpeedResistanceFanTool());
chart.registerPlugin(fibGroup);

const patternGroup = new QFChart.ToolGroup({
  name: 'Patterns',
  icon: `<svg>...</svg>`,
});
patternGroup.add(new QFChart.XABCDPatternTool());
patternGroup.add(new QFChart.ABCDPatternTool());
patternGroup.add(new QFChart.CypherPatternTool());
patternGroup.add(new QFChart.HeadAndShouldersTool());
patternGroup.add(new QFChart.TrianglePatternTool());
patternGroup.add(new QFChart.ThreeDrivesPatternTool());
chart.registerPlugin(patternGroup);
Clicking the group button opens a dropdown menu. When a tool is selected, the group’s icon updates to show the active sub-tool.
Extensible Plugin Architecture
The biggest architectural change in v0.8 is the plugin system refactor. Previously, adding a new drawing type required modifying QFChart’s core rendering code. Now, each drawing tool is fully self-contained.
How it works
Each plugin lives in its own folder with two files:
- Tool -Handles user interaction (clicks, preview graphics, state machine)
- DrawingRenderer -Handles permanent chart rendering (ECharts graphic elements)
The plugin registers its renderer during initialization:
protected onInit(): void {
  this.context.registerDrawingRenderer(new MyDrawingRenderer());
}
Zero changes to QFChart.ts are needed to add a new drawing type. This means:
- Third-party developers can create custom drawing tools as npm packages
- The chart core has no knowledge of any specific drawing type
- Adding or removing tools doesn’t affect the bundle size of unused tools
The DrawingType was widened from a fixed union ('line' | 'fibonacci') to an open string, so any plugin can define any type name.
Resizable Indicator Panes
Indicator pane borders are now interactively draggable. Hover over the boundary between the main chart and an indicator pane (or between two indicator panes) and the cursor changes to row-resize. Drag to redistribute height between neighboring panes in real time.
Minimum heights are enforced (10% for the main pane, 5% per indicator) to prevent accidentally collapsing a pane. Heights persist across re-renders.
Auto-Expanding Viewport
Previously, the chart allocated a fixed percentage of empty bars on each side for scrolling room. In v0.8, the chart starts with a minimal 5-bar buffer and automatically expands when the user scrolls near an edge.
When you scroll within 10 bars of either edge, the chart adds 50 bars of padding per side (up to a hard cap of 500 bars). The viewport position is preserved across expansions -there’s no visual jump. This means you can freely pan left into deep history or right past the last bar without hitting a wall.
Box, Polyline & Table Drawing Objects (v0.7.0)
Three new drawing object types were added, expanding the range of Pine Script features QFChart can render:
Box Renderer
Renders Pine Script box.* objects -filled rectangles with configurable border color/width/style, optional text, and extend modes. Supports 8-digit hex colors (#RRGGBBAA).
Polyline Renderer
Renders Pine Script polyline.* objects -multi-point connected paths from chart.point arrays, with straight or curved segments, optional closed shapes, and fill color.
Table Renderer (Canvas-Based)
Tables went through two iterations. v0.7.0 introduced TableOverlayRenderer (HTML-based DOM overlays). v0.8.0 completely rewrote it as TableCanvasRenderer -all table cells are now ECharts canvas graphics, which means:
- Pixel-perfect sizing (Pine Script
%maps directly to px) - Tables participate in the single render pipeline (exports, animations, resize)
- Better performance for large tables
- Correct z-ordering with other chart elements
Gradient Fills (v0.7.2)
Fill plots now support Pine Script’s gradient fill variant. When plotOptions.gradient === true, each polygon segment renders with a vertical linear gradient mapping top_color to the higher-value boundary and bottom_color to the lower-value boundary.
Rendering Improvements
Across v0.7 and v0.8, dozens of rendering bugs were fixed. The most impactful:
- Custom candle colors -Fixed ECharts coercing string colors to
NaNin custom series data - Fill rendering -Fixed multi-color fills, streaming reference data loss, and gradient support
- Drawing object Y-axis decoupling -Drawing objects no longer force the Y-axis to encompass their coordinates, so the axis adapts naturally when scrolling through history
- Render clipping -All custom series (lines, linefills, boxes, polylines) now properly clip to their grid area
- Histogram rewrite -Histograms now support
histbase(e.g., RSI centered on 50) and correctly distinguish thin histograms from thick columns - Live streaming -Fixed multiple issues with indicators losing colors, rendering options, and polyline coordinates during incremental updates
- Drawing tool coordinates -Points are now stored as real data indices (not padded), so viewport expansion doesn’t invalidate drawing positions
Installation
npm install @qfo/qfchart@latest echarts
Or via CDN:
<script src="https://cdn.jsdelivr.net/npm/echarts@5/dist/echarts.min.js"></script>
<script src="https://cdn.jsdelivr.net/npm/@qfo/qfchart/dist/qfchart.min.browser.js"></script>
Leave a Reply