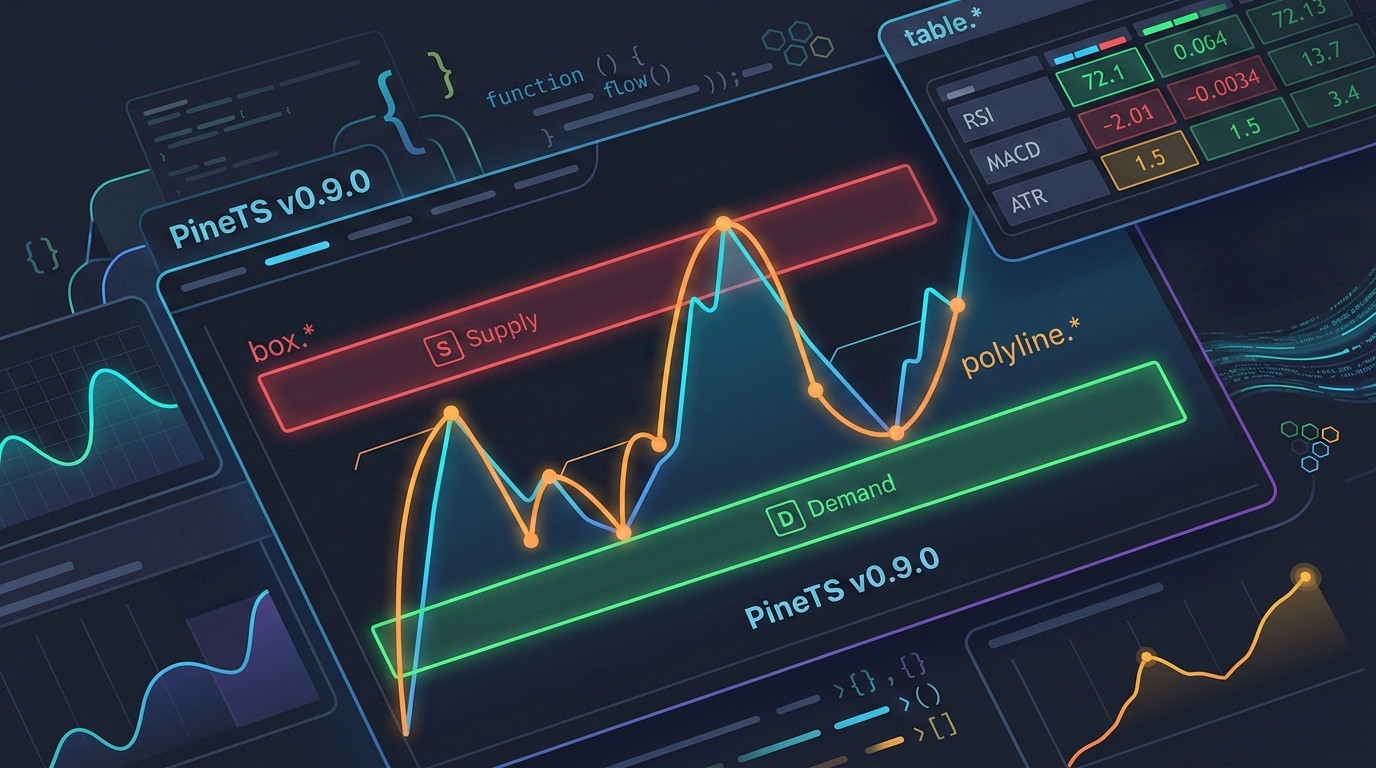
We’re excited to announce PineTS v0.9.0! This is our biggest drawing-objects release yet. After shipping line.*, linefill.*, and label.* in the v0.8.x cycle, v0.9.0 completes the TradingView drawing primitives suite with full implementations of box.*, table.*, and polyline.*. On top of that, 900+ test cases land in this release alongside a wave of precision fixes for TA functions, the transpiler, and request.security.
Drawing Objects: Now Complete
Box Namespace (box.*)
box.new() lets you draw rectangles on the chart defined by two corners and a time/price range – ideal for supply/demand zones, fair value gaps, or any rectangular region of interest.
The full box.* namespace is now implemented:
- Creation & lifecycle:
box.new(),box.copy(),box.delete() - Position setters:
set_left,set_right,set_top,set_bottom,set_extend - Style setters:
set_bgcolor,set_border_color,set_border_width,set_border_style - Text setters:
set_text,set_text_color,set_text_size
//@version=6
indicator("Supply & Demand Zones", overlay=true)

var box supplyZone = na
var box demandZone = na

// Draw a supply zone when we make a higher high
if ta.crossover(close, ta.highest(high, 20)[1])
    supplyZone := box.new(
        left    = bar_index - 10,
        top     = ta.highest(high, 10),
        right   = bar_index,
        bottom  = ta.highest(high, 10) - ta.atr(14),
        bgcolor = color.new(color.red, 80),
        border_color = color.red,
        border_width = 1,
        text    = "Supply",
        text_color = color.red,
        text_size  = size.small
    )

// Draw a demand zone on a lower low
if ta.crossunder(close, ta.lowest(low, 20)[1])
    demandZone := box.new(
        left    = bar_index - 10,
        top     = ta.lowest(low, 10) + ta.atr(14),
        right   = bar_index,
        bottom  = ta.lowest(low, 10),
        bgcolor = color.new(color.green, 80),
        border_color = color.green,
        border_width = 1,
        text    = "Demand",
        text_color = color.green,
        text_size  = size.small
    )
QFChart renders boxes as filled rectangles with configurable fill color, border color/width/style, and optional text label. 8-digit hex colors (#RRGGBBAA) are automatically converted to rgba() for canvas compatibility.
Table Namespace (table.*)
Tables let you display structured data directly on the chart – dashboards, scorecards, signal summaries, and statistics panels.
The full table.* namespace is implemented:
- Creation & lifecycle:
table.new(),table.delete() - Cell management:
table.cell(),table.cell_set_text(),table.cell_set_bgcolor(),table.cell_set_text_color(),table.cell_set_text_size(),table.cell_set_border_color(),table.cell_set_border_width()
Tables are positioned at fixed screen locations (position.top_left, position.bottom_right, etc.) and rendered as DOM overlays in QFChart – just like TradingView does it.
//@version=6
indicator("Indicator Dashboard", overlay=true)

rsi  = ta.rsi(close, 14)
macd_line = ta.ema(close, 12) - ta.ema(close, 26)
atr  = ta.atr(14)

var table dashboard = table.new(
    position   = position.top_right,
    columns    = 2,
    rows       = 4,
    bgcolor    = color.new(color.black, 70),
    border_color = color.gray,
    border_width = 1
)

// Header row
table.cell(dashboard, 0, 0, "Indicator", text_color=color.white, text_size=size.small)
table.cell(dashboard, 1, 0, "Value",     text_color=color.white, text_size=size.small)

// RSI row
rsiColor = rsi > 70 ? color.red : rsi < 30 ? color.green : color.white
table.cell(dashboard, 0, 1, "RSI(14)",   text_color=color.gray,  text_size=size.small)
table.cell(dashboard, 1, 1, str.tostring(math.round(rsi, 2)),
           text_color=rsiColor, text_size=size.small)

// MACD row
macdColor = macd_line >= 0 ? color.green : color.red
table.cell(dashboard, 0, 2, "MACD",      text_color=color.gray,  text_size=size.small)
table.cell(dashboard, 1, 2, str.tostring(math.round(macd_line, 4)),
           text_color=macdColor, text_size=size.small)

// ATR row
table.cell(dashboard, 0, 3, "ATR(14)",   text_color=color.gray,  text_size=size.small)
table.cell(dashboard, 1, 3, str.tostring(math.round(atr, 2)),    text_size=size.small)
Pine Script behavior preserved: When multiple tables are placed at the same screen position, only the last one (most recently created on the final bar) is displayed – exactly matching TradingView’s “last table wins” rule.
Polyline Namespace (polyline.*)
Polylines let you draw multi-point connected paths from arrays of chart.point objects – useful for custom waveforms, price projections, Elliott Wave annotations, or any connected line through arbitrary chart points.
//@version=6
indicator("Pivot Path", overlay=true)

// Collect recent pivot highs and connect them with a polyline
var pivotPoints = array.new<chart.point>()

ph = ta.pivothigh(high, 5, 5)
if not na(ph)
    array.push(pivotPoints, chart.point.from_index(bar_index[5], ph))
    if array.size(pivotPoints) > 6
        array.shift(pivotPoints)

var polyline pvLine = na
if barstate.islast and array.size(pivotPoints) >= 2
    polyline.delete(pvLine)
    pvLine := polyline.new(
        points       = pivotPoints,
        curved       = false,
        closed       = false,
        line_color   = color.new(color.orange, 0),
        line_width   = 2
    )
polyline.new() supports straight or curved segments, optional closed shapes (connecting the last point back to the first), line color, width, and fill color for closed polygons.
Pine Script v6: enum Keyword Support
Pine Script v6 introduced enum declarations for named constant groups. PineTS v0.9.0 adds full transpiler support for enum syntax:
//@version=6
indicator("Enum Signal Labels", overlay=true)
enum Signal
    Buy
    Sell
    Neutral
getSignal(rsi) =>
    if rsi < 30
        Signal.Buy
    else if rsi > 70
        Signal.Sell
    else
        Signal.Neutral
rsi = ta.rsi(close, 14)
sig = getSignal(rsi)
if sig == Signal.Buy
    label.new(bar_index, low, "BUY", color=color.green, textcolor=color.white, style=label.style_label_up, size=size.small)
if sig == Signal.Sell
    label.new(bar_index, high, "SELL", color=color.red, textcolor=color.white, style=label.style_label_down, size=size.small)
Primitive Type Cast Expressions
PineTS now correctly parses int(), float(), and string() used as explicit type cast expressions – a common pattern in typed Pine Script code:
//@version=6
indicator("Type Casts", overlay=true)

x = 3.7
i = int(x)      // Cast to integer (truncates)
f = float(i)    // Cast back to float
s = string(str.tostring(i))  // Convert to string for table/label display

plot(i, "Int Value")
TA Precision & Correctness Fixes
TA Backfill in Conditional Blocks
This was a subtle but impactful bug. If a window-based TA function (ta.sma, ta.highest, ta.lowest, ta.stdev, ta.cci, etc.) is called inside a conditional block, it was only executed on bars where the condition was true – leaving its internal rolling window incomplete on skipped bars. When the condition became true again, it would calculate from an incomplete window.
v0.9.0 fixes this with source-series backfill: when the function is called after a gap, it reconstructs the window from the source series history before returning the current value.
//@version=6
indicator("Conditional TA", overlay=true)

// This now correctly calculates even though sma is only needed sometimes
useEma = input.bool(true, "Use EMA")

result = if useEma
    ta.ema(close, 20)
else
    ta.sma(close, 20)  // Window now stays consistent even when this branch is inactive

plot(result, "MA")
The fix covers: sma, highest, lowest, stdev, variance, dev, wma, linreg, cci, median, roc, change, alma.
TA Function-Variable Hoisting
ta.obv, ta.tr, and similar TA members that behave as both a value and a function call must be evaluated on every bar to maintain accurate rolling state – regardless of whether they appear inside a conditional. These are now hoisted to the top of the context function, guaranteeing they always run.
//@version=6
indicator("OBV in Condition", overlay=true)

obv = ta.obv  // Always evaluated now, even if used inside an if block
signal = ta.ema(obv, 10)

// This correctly reflects the full OBV history
if barstate.islast
    label.new(bar_index, obv, str.tostring(math.round(obv)))
math.round – Pine Script Semantics
JavaScript’s Math.round() rounds half towards positive infinity (i.e., 0.5 → 1, -0.5 → 0). Pine Script’s math.round() rounds half away from zero (i.e., 0.5 → 1, -0.5 → -1). PineTS now matches Pine Script’s behavior:
//@version=6
indicator("Round Test")

// Pine Script: math.round(-0.5) = -1
// JavaScript:  Math.round(-0.5) = 0  ← was incorrectly using this
plot(math.round(-1.5), "Round -1.5")  // Correctly returns -2
plot(math.round(1.5),  "Round 1.5")   // Correctly returns 2
RSI Accuracy Fix
An edge case in the RSI calculation affecting certain initial bar configurations has been corrected. Results now match TradingView’s output for all tested datasets.
request.security Fixes
syminfo.tickerId with Provider Prefix
When syminfo.tickerId contains a provider prefix (e.g., "BINANCE:BTCUSDT"), request.security now correctly strips the prefix before lookup. Previously, the full string including the colon-separated prefix was passed as the symbol, causing lookups to fail silently.
//@version=6
indicator("MTF Example")

// syminfo.tickerId returns "BINANCE:BTCUSDT" from the Binance provider
// request.security now correctly resolves this to "BTCUSDT"
weeklyClose = request.security(syminfo.tickerId, "1W", close)
plot(weeklyClose, "Weekly Close")
Tuple Returns from request.security
request.security can now correctly unwrap and return tuples from the secondary context:
//@version=6
indicator("MTF Bollinger Bands", overlay=true)

[wMid, wUpper, wLower] = request.security(
    syminfo.tickerId, "1D",
    ta.bb(close, 20, 2.0)
)

plot(wMid,   "Daily BB Mid",   color=color.blue)
plot(wUpper, "Daily BB Upper", color=color.red)
plot(wLower, "Daily BB Lower", color=color.green)
fill(plot(wUpper, display=display.none), plot(wLower, display=display.none),
     color=color.new(color.blue, 90))
Transpiler Fixes
| Area | Fix |
|---|---|
| Multi-level nested conditions | Deeply nested if/else if/else chains spanning multiple indentation levels now transpile correctly |
| IIFE double-transformation | Already-transformed IIFE nodes are no longer re-processed, preventing corrupted output |
| Switch/case edge cases | Fixed missing default cases and complex multi-line case bodies |
color.* edge cases | Several color function edge cases for correct RGBA string generation |
na == na equality | Correctly returns false – the __eq() transpilation path was not applied consistently in all conditional paths |
na == na Equality
In Pine Script, na == na is false – na is not equal to itself, matching IEEE 754 NaN semantics. PineTS was already generating $.pine.math.__eq() calls for == comparisons, but there was a code path where the transformation wasn’t applied consistently, causing na == na to incorrectly return true in some cases. This is now fixed across all branches.
Type Name Compliance
Internal constant names are now fully aligned with Pine Script’s exact naming convention. This matters because PineTS feeds constants directly into QFChart renderers – any mismatch would cause a drawing object to render with incorrect style or not at all.
Constants like label styles, line styles, shape types, and size presets now match Pine Script verbatim, so indicators copy-pasted from TradingView just work without any manual constant mapping.
QFChart v0.7.0: Rendering the New Drawing Primitives
PineTS v0.9.0 ships alongside QFChart v0.7.0, which adds the renderers needed to visualize the new namespaces:
BoxRenderer– Renders filled rectangles with configurable fill, border, and textPolylineRenderer– Renders multi-point paths with curve and fill supportTableOverlayRenderer– Renders tables as DOM overlays anchored to fixed screen positions
QFChart v0.7.0 also fixes render clipping for all custom drawing objects (lines, linefills, boxes, polylines) – they now correctly clip to the chart grid area instead of potentially overflowing outside the plot bounds.
Installation & Upgrade
npm install pinets@latest
Or with the CLI:
npm install -g pinets-cli
pinets run my_indicator.pine --symbol BTCUSDT --timeframe 1D
Bug Fixes Summary
- Fixed
na == naequality returningtruein some conditional paths - Fixed TA backfill for window-based functions in conditional closures
- Fixed
ta.obvandta.trnot being evaluated on skipped bars - Fixed RSI calculation edge cases
- Fixed
math.roundto use “half away from zero” semantics matching Pine Script - Fixed
request.securitydropping results whensyminfo.tickerIdcontains a provider prefix - Fixed
request.securityfailing to unwrap tuple returns - Fixed multi-level nested
if/else if/elsetranspilation - Fixed IIFE double-transformation in transpiler
- Fixed switch/case edge cases (missing defaults, complex multi-line bodies)
- Fixed several
color.*RGBA generation edge cases - Fixed
hlineconsistency (contributed by @dcaoyuan)
Get Involved
PineTS is open-source (AGPL-3.0). We welcome contributions, bug reports, and feature requests.
Leave a Reply